위성정보 가시화 솔루션 Satellite Data Visualization Solution
Environmental satellite visualization results based on WebGL GPU parallelization programming (improvement and commercialization in progress)
Solution Features
Intuitive
Model data layer configuration and overlap. Satellite Missing Complementary Visualization Technology
Reactive type
Web High Speed Programming and Reactive
Image/vector data
Develop visualization techniques tailored to data characteristics
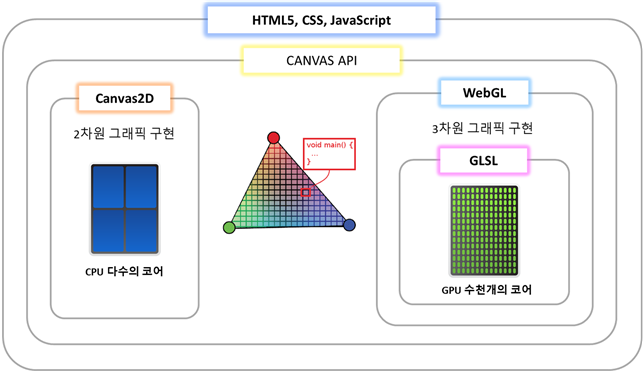
WebGL
Implementing 3D graphics, WebGL, Canvas2D, Container, Web Assembly
GLSL(OpenGL Shading Language)
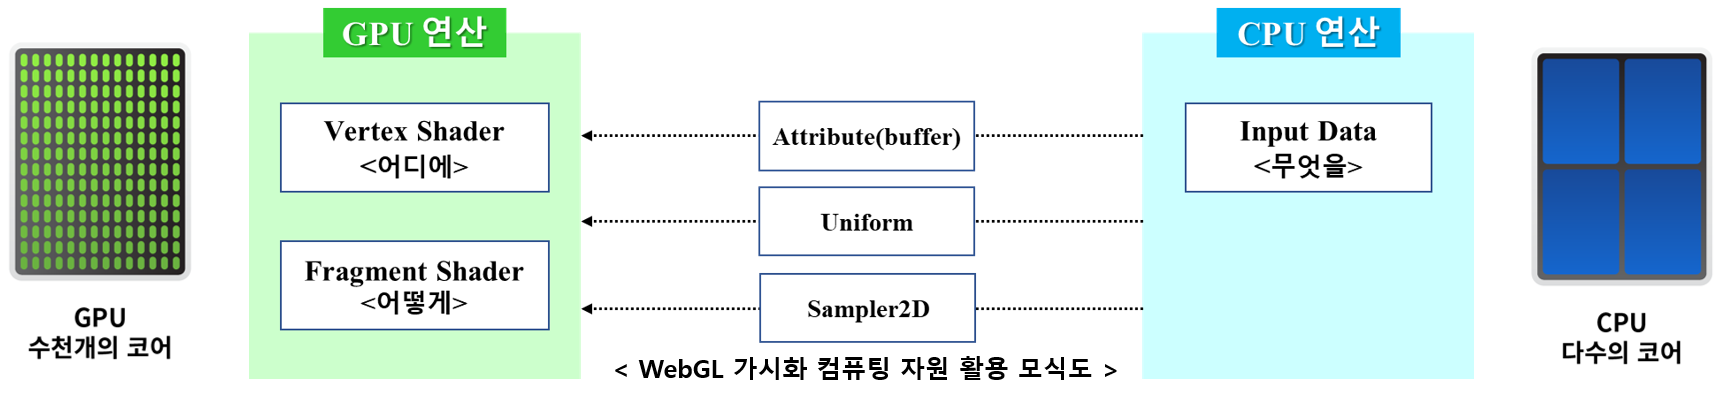
CPU GPU Parallelization Programming Visualization Technology
Utilization
Environmental, meteorological, and marine satellite calculation information visualization solution
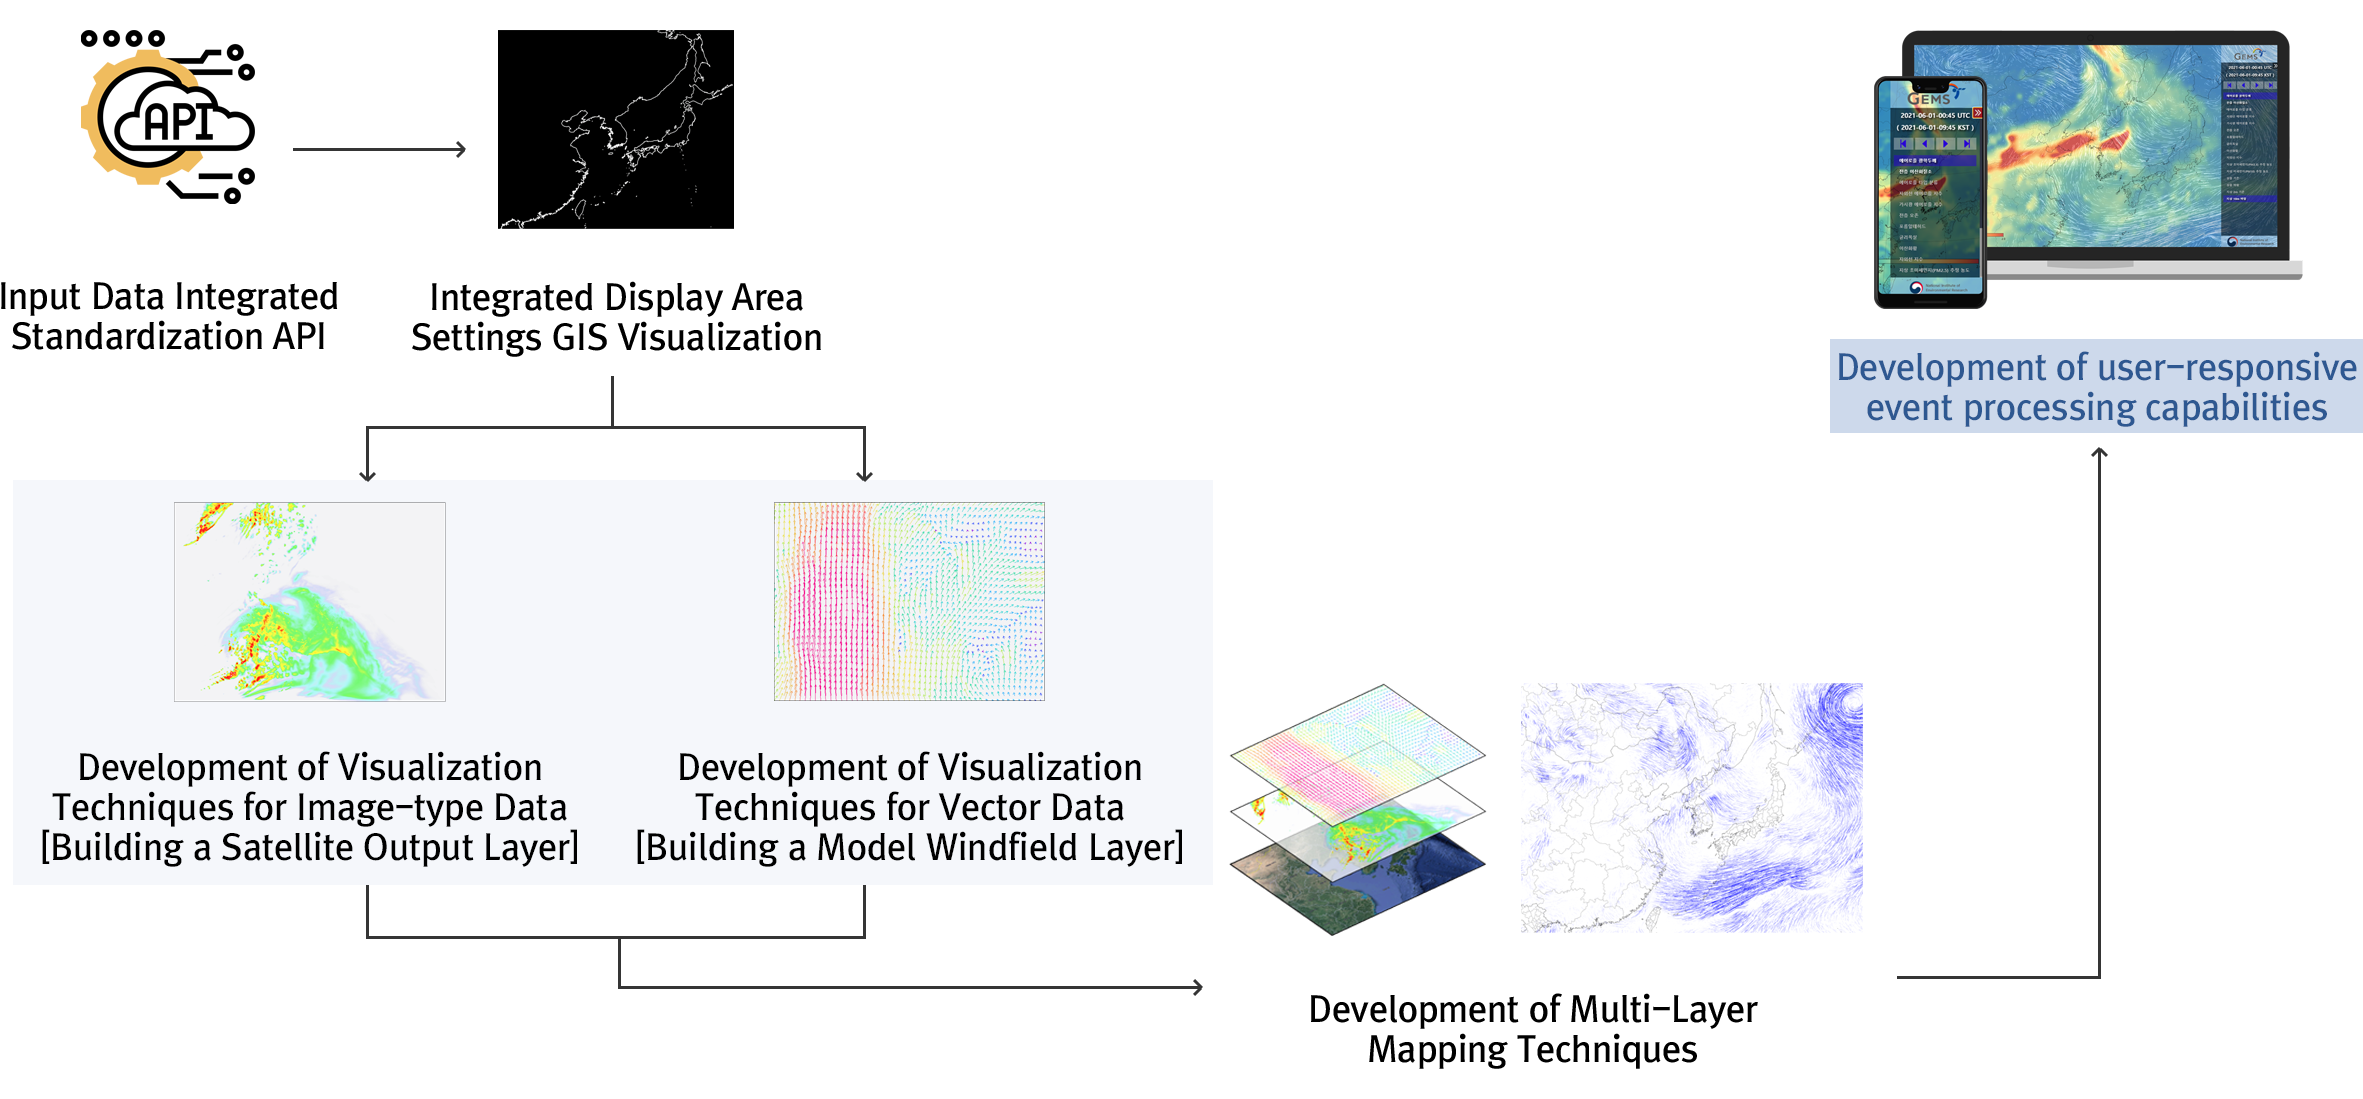
Satellite Information Visualization Flowchart
Visualization Method of Satellite Information Complementation
Complementing the missing data by combining satellite information and numerical models
Satellite Information Visualization Solution Structure and Differentiation
GPU direct computational design and parallelization based on OpenGL ES 2.0 for faster user responsive processing and loading (within 0.5 seconds of notebook time)
Minimize system deployment costs, streamline resources, and secure with the latest APM and container technologies
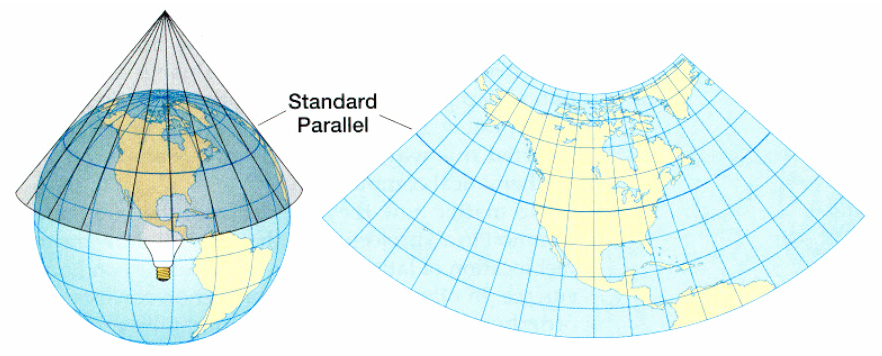
✅ Providing Optimal Geographic Information through the Application of Map Projection Method
Lambert Conformal Conic Projection
One of the conical map projections with relatively high accuracy in the mid-latitude region
The area of the map projected in a projection manner that preserves the area is proportional to the actual area of the earth
The most accurate representation of the terrain of the area to be projected by adjusting the angle and center position of the projection cone
Consistent Operating Environment
· Container technology can be used to match the operating environment with the company’s development environment · Container technology can be used to isolate software and provide a consistent operating environment to maintain consistency and stability between development and operations