Environment, Weather, Marine, Disaster, Agriculture & Renewable Energy
Real-time automated observation monitoring solution
RTOM
실시간 자동관측 모니터링 솔루션
RTOM (Rear Time Observation and Monitoring Solution)
The real-time automated observation monitoring solution, along with DIGIQUAY’s precision weather information production technology, provides accurate observation monitoring information in the fields of environment, weather, ocean, disaster, agriculture, construction, leisure and renewable energy.
It provides accurate information to users to help them make more effective decisions and perform tasks in a variety of fields.


Solution Utilization Areas

Agriculture
You can improve crop productivity by collecting weather information that affects crop growth and productivity.

Ocean
It is used to collect weather information such as wind speed, wave height, etc. to improve drainage efficiency and to operate safely.

Flight
You can gather weather information necessary for air navigation to know the route and flight safety in advance.

Energy
It collects weather information from energy industries such as solar and wind power plants and is used for productivity improvement and operation.

Construction
It collects weather information from the construction site and is efficient for safe working environment and scheduling.

etc
It can also be used in various fields such as sports, travel, tourism, and environment.
Key Advantages

Real-time observation
Provide Data

24-hour data
Check the amount of change

Web/App Service

Drone observation data
Solution Delivery Data

Temperature

Humidity

Wind direction

Wind speed

Atmospheric pressure
Why RTOM?
- extensive meteorological and climatological expertise
- Trusted input equipment, including radar and local sensor data
- Stringent quality control measures
- Homogenized weather data
- Stringent quality control measures
- Weather data collected continuously from 2019 to the present (BIG DATA)
- Future drone observation data will be integrated to provide accurate weather information for a wide range of regions
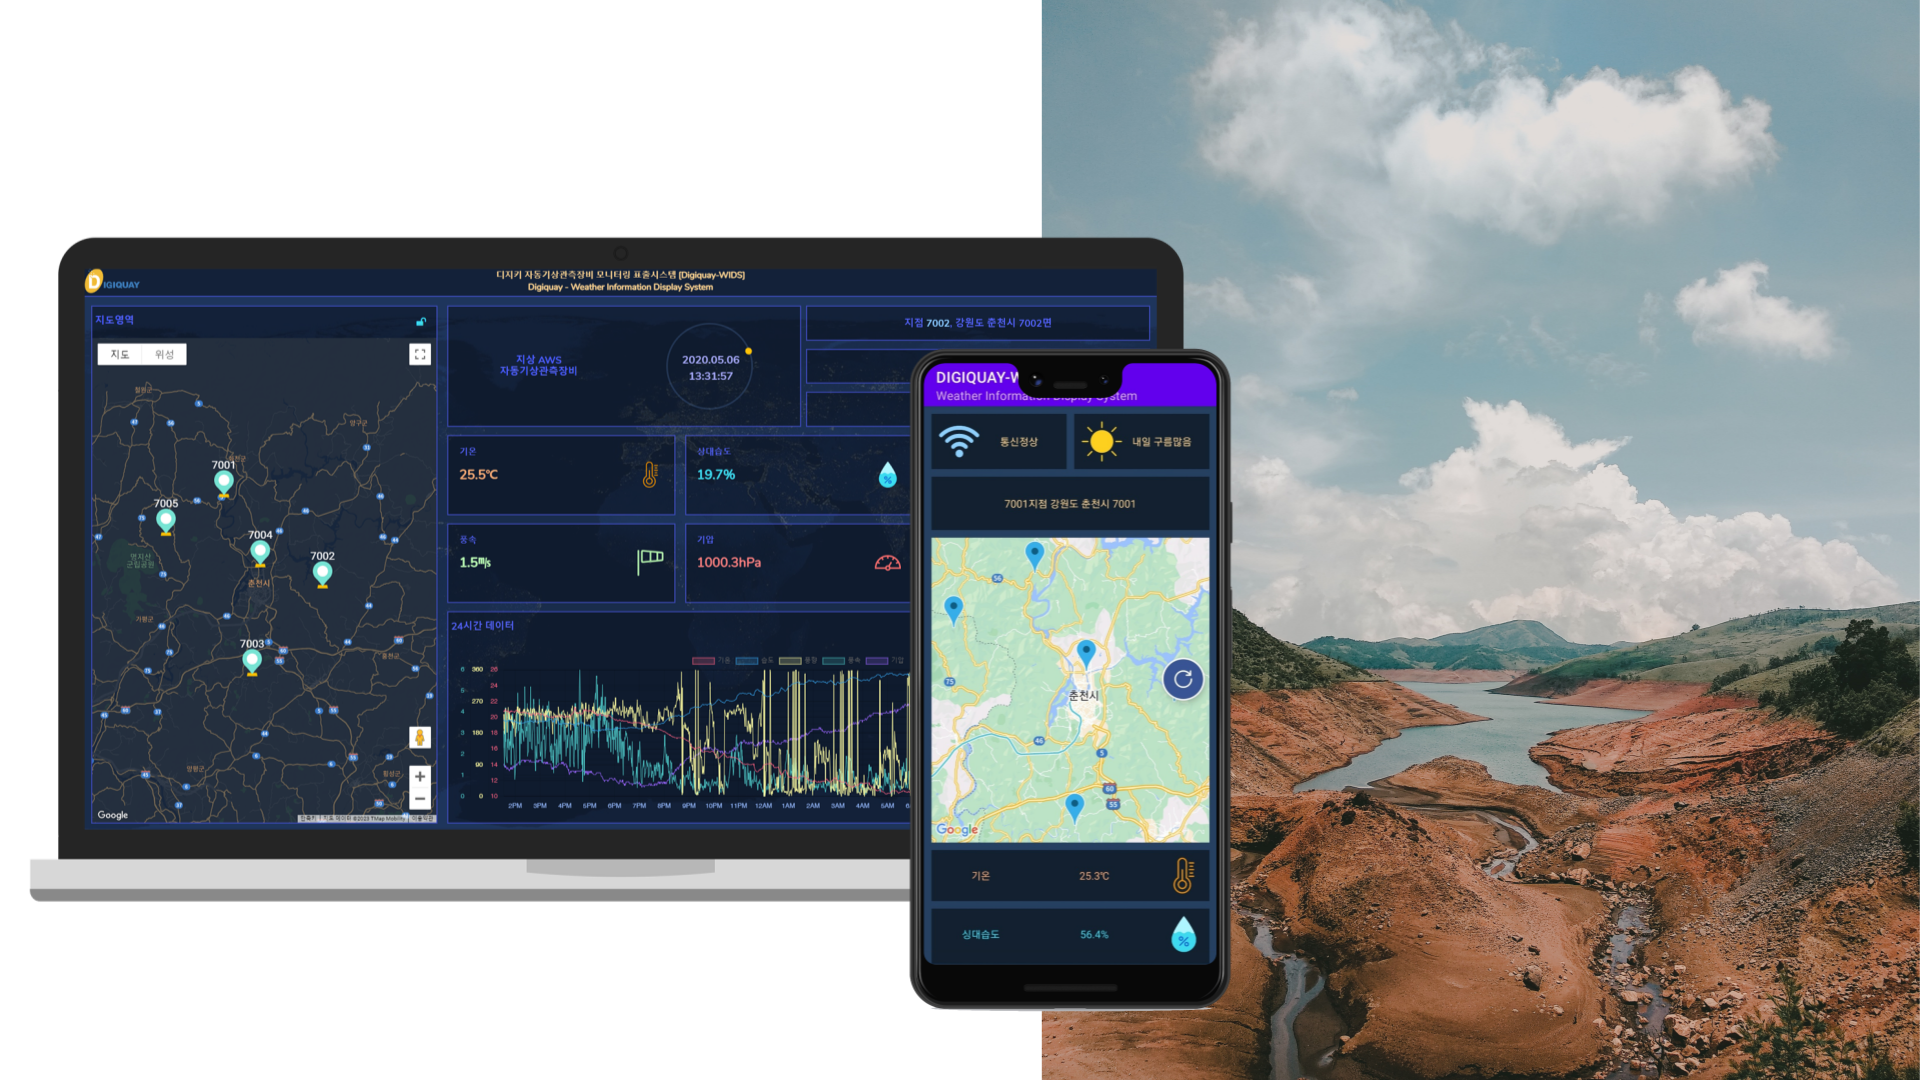
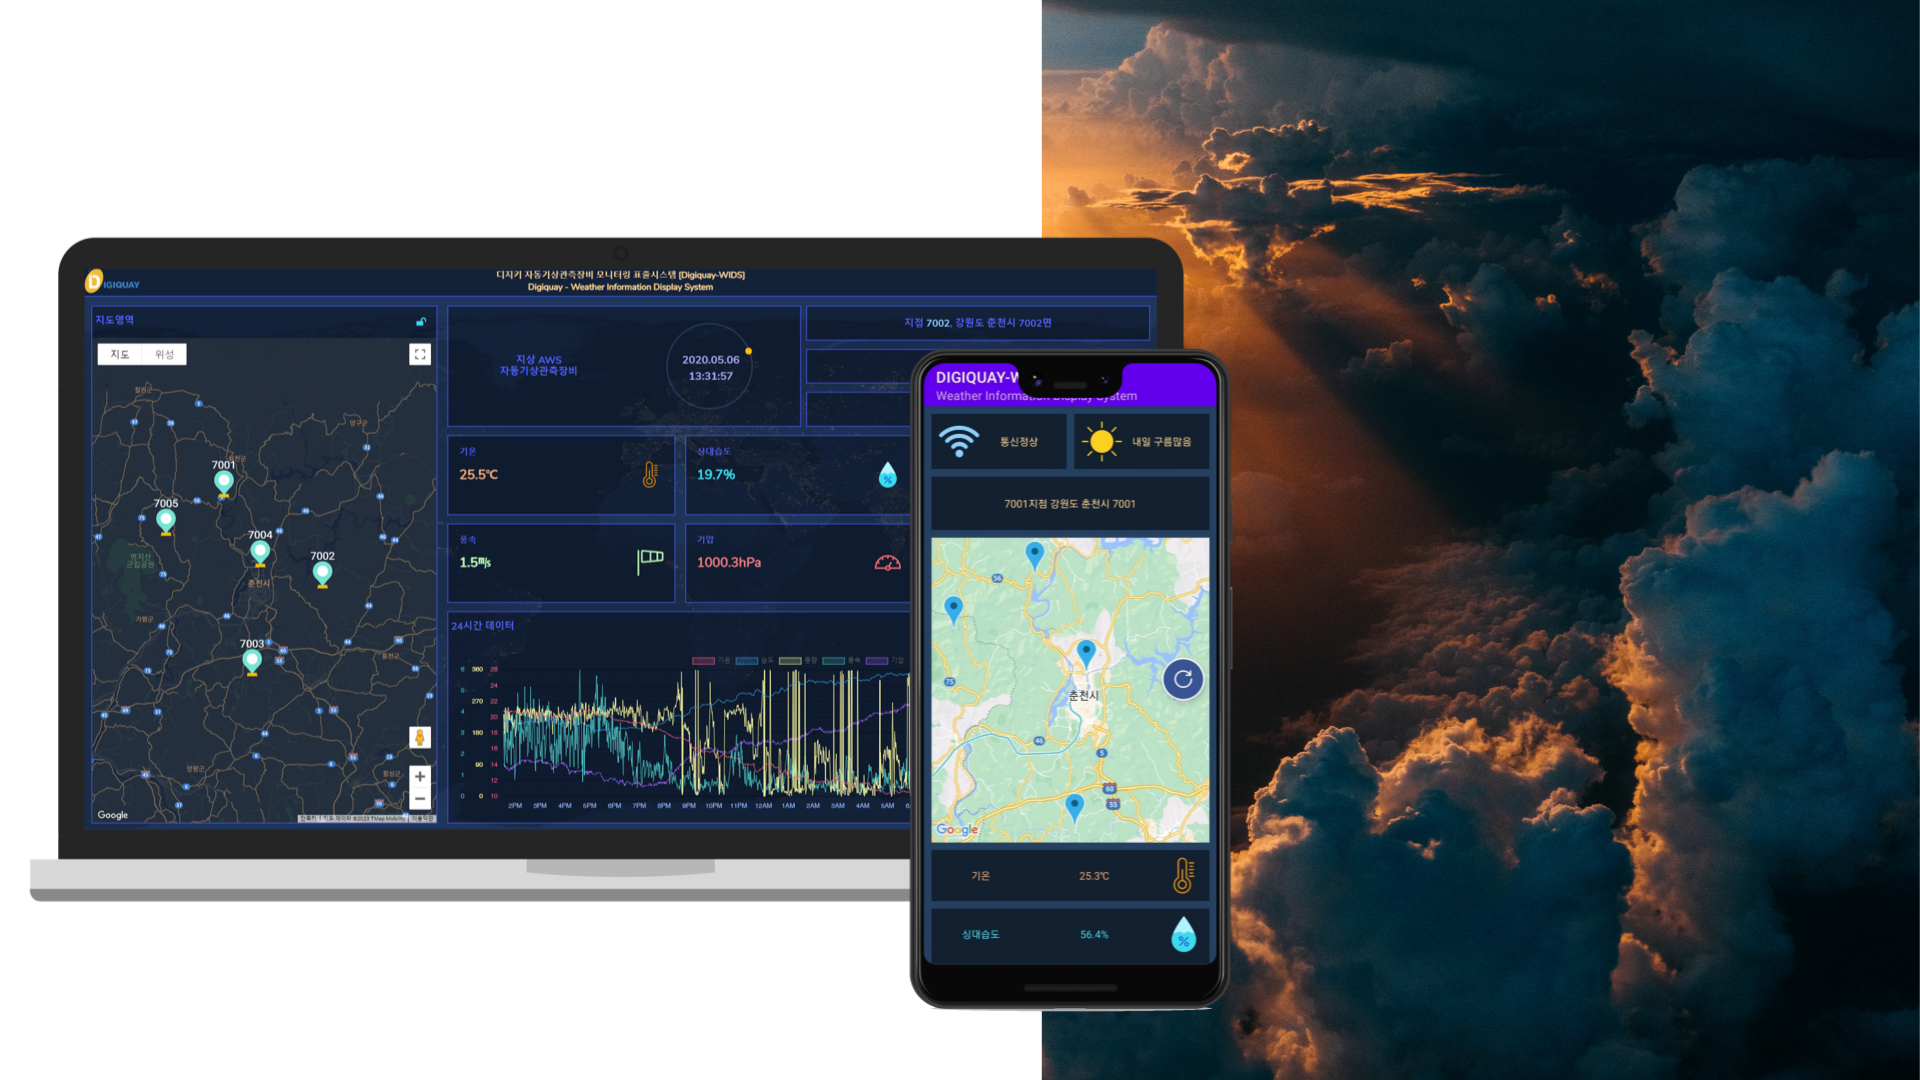
Web Dashboard Preview
On the left side of the dashboard is a map area showing the location of the observation equipment.
The user can select the desired observation point on the map and view the changes in real time in the data area on the right.
Data by observation point is displayed on the right side of the dashboard. The user can select an observation point of interest and view the weather information measured at that point.
By default, you can see the current time, the name and address of the observation point, the status of the network connection, and tomorrow’s weather forecast.
In addition, you can check temperature, humidity, air pressure, wind direction, and wind speed in real time, and you can check the data flow for 24 hours.

Visit Site
The solution is based on the latest automated weather observation equipment to help users make more accurate decisions.
Visit the website for more information.
